Developer Insights #9 – Orbit Tessellation
Hello all, I’m Johannes Peter – A programmer on Kerbal Space Program 2 – and I love solving interesting problems!
The problems we face in game development rarely have a single “correct” answer. The more specialized your game is, the more specialized your problems are, and the more creative your solutions need to be. As a rocketry simulator on an interplanetary scale, Kerbal Space Program has already tackled a wealth of unique programming challenges.
Today I want to share a solution I’ve worked on for a problem that is fairly unique to KSP: How to draw accurate orbits that look stellar regardless of where they’re viewed from?
I’ll briefly cover a standard approach for drawing orbits, touch on some of the issues with that approach, and then look at the solution that KSP2 is using now: screen space orbit tessellation.
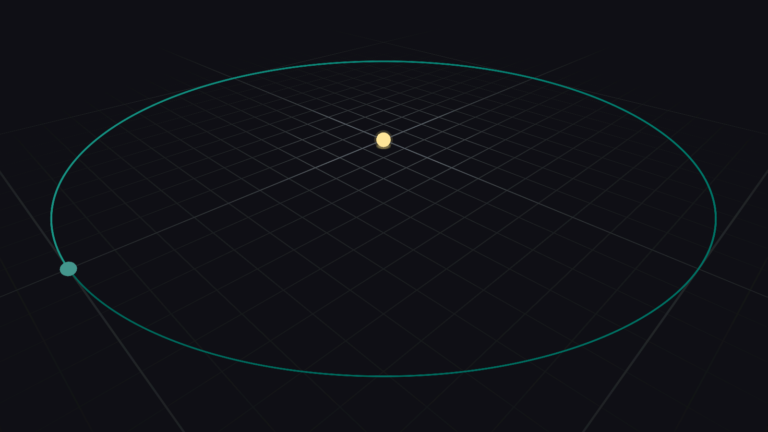
This dev diary will get a bit into the technical side of KSP2’s development, with diagrams to help illustrate some of the core concepts. We will mainly focus on this test scene of Kerbin orbiting Kerbol:

Quick disclaimer:
All visuals were created specifically for this dev diary, and are in no way representative of how anything may look in the final game. It’s just programmer art.
All code, while functional, is simplified for clarity.
All orbits are to scale and celestial bodies are a constant screen size to make them easy to see.
Orbital Trajectories in KSP
I hope it isn’t too hyperbolic of me to say, but KSP is all about orbits. Building, flying, and crashing rockets are all core to KSP’s identity, but if I had to describe KSP with one defining characteristic, it would be that it teaches you how orbits work on an intuitive level, just by playing it.
While there are definitely exceptions (you know who you are), most players depend on the Map View to plan their journeys from launchpad A to crater B, so being able to display lots of orbits without visual artifacts is critical.
What is an Orbit?
An orbit is the path that an object takes as it moves through space while under the gravitational influence of other objects around it. Real life orbits are chaotic and not deterministic. Without performing many small iterative calculations, it is generally not possible to say for certain where an object will be in space at an arbitrary point in time.
This is one of the reasons why KSP simplifies its orbital mechanics so that generally you’re only within the sphere of influence of one celestial body at a time. These kinds of orbits are known as Kepler orbits where position and velocity at any point on the orbit can be described using parametric equations. With a parametric equation we can plug in a parameter—like a time or an angle—and get an accurate position or velocity.
If a curve can be described as a parametric equation it is easy for us to draw.
Drawing Parametric Curves
In general, to draw a parametric curve we need to:
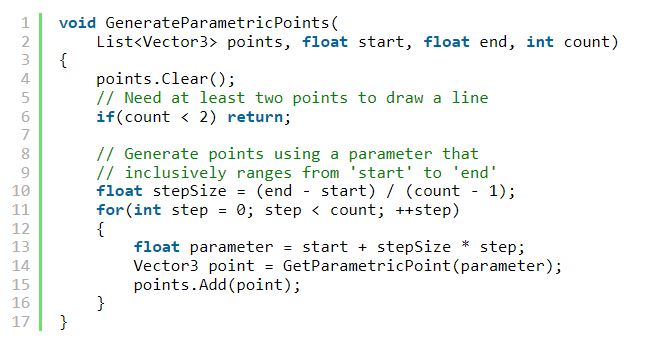
Choose a start and end parameter, as well as how many points we want to generate.
Generate the points by passing values into the parametric function that range from start to end.
Draw a line between each consecutive pair of points.
For example, to draw a standard sine wave, we can use this parametric function:

With that function we can use a start and end parameter to generate our points:

And assuming that we have a function to draw a line between two points, we can finally draw the lines between the points we just generated:

Here is an example of what that looks like:
The green line is the ideal sine curve that we want to draw, and the blue line is the result of our GenerateParametricPoints and DrawParametricCurve functions.
Changing the start and end parameters (shown here in degrees) affects the position and length of the curve and the more points we generate the better the lines match the ideal curve.
Drawing an Orbit
Let’s assume that we have the following:
A parametric equation of our orbit. The exact equation is, but for those curious, you can see better results if it uses the as its parameter.
A start and an end parameter that we’ll step between. A full orbit’s parametric equation generally ranges from 0 to 2π radians, or 0 to 360 degrees.
The number of points we want to generate. The default in KSP1 is 180 points for a full orbit.
A graphics package to do the rendering. We need a way to draw a line between two points.
As with the sine wave, we generate points using parameters ranging from the start to the end value, and by increasing the number of points we generate, we get a smoother looking orbit:
Of course there’s a lot that I’m glossing over here, such as more efficient ways to draw lines than one at a time or other optimizations, but in a nutshell this is how orbits were drawn in KSP1.Adding some Perspective
Evenly distributing the points of an orbit yields excellent results when viewed from far away, specifically when the camera is not close to the plane that the orbit is on. However, in KSP you frequently view orbits from extremely flat angles. For example, when zoomed in close enough to see the moon of a planet, the orbit of the planet will be almost completely flat.
Let’s add the orbits of Kerbin’s moons Mun and Minmus to our example scene:
When we zoom in on Kerbin’s moons, we see sharp corners on Kerbin’s orbit. The orbit line also misses Kerbin by a significant margin. Even though we generated Kerbin’s orbit with 180 points, the distance between two points is still about 5 times larger than Minmus’ entire orbit:
If we evenly distribute the points around the orbit, then with orbits as large as those in KSP we run into scenarios where there may not be enough points from the camera’s point of view to look smooth.We could increase the point count, but we’ll quickly run into diminishing returns. Much of the orbit already looks smooth so adding points there would be a waste, while due to the angle of the camera other parts of the orbit don’t have enough points.
… What if we could add points only where they’re needed?
Screen Space Line Tessellation
If you have two points that were generated with a parametric equation you can generate a new point between them by averaging their parameters:

We can start with a small set of points and insert new ones by averaging their parameters. The curve becomes smoother each time we do this:

In computer graphics tessellation is the process of dividing geometry to make it smoother. We are effectively tessellating our parametric curve. We really only care that the curve appears smooth on the screen, so we want to evaluate the smoothness of our points in screen space, where the X and Y coordinates correspond to the point’s screen position:

With our points in screen space, we can insert a new point between points A and B based on how smooth the curve is there. But how do we define ‘smoothness’?
Choosing a Smoothness Heuristic
A heuristic is a rule-of-thumb; a method for solving a problem very fast while being adequately accurate. We need a heuristic to efficiently decide if our points are ‘smooth enough’. We’ve mentioned two heuristics so far:
The distance between points. If points are visually close together then they’re less noticeable.
The angle between points. The closer three points are to a straight line the less their middle corner stands out.
A convenient heuristic that incorporates both is the triangle area, which we can compute very quickly using the shoelace formula:

If the triangle of a, b and c in screen space has an area larger than a given upper limit, then we insert a new point between a and b to smooth out the curve. We evaluate our heuristic on every consecutive set of three points, until all points satisfy our heuristic, or we reach another end condition like how many points we have in total.
It can help to visualize the triangles:
Putting it all together
We can apply the triangle heuristic to our orbits, coloring each point based on the Iteration it was added in—red first, then orange, yellow, and so on:
The orbits are tessellated using the top-right camera and the turquoise lines show the viewing bounds of that camera. The top-left shows a close up of Kerbin and its moons. The closer the camera moves to the orbit, the more iterations need to be performed to satisfy our heuristic, but we also use far fewer points overall because we only generate points where needed. For example the orbits of Mun and Minmus only generate new points when they become visible. Here’s the original shot again with tessellation enabled and all debug drawing removed:And that, in a nutshell, is how orbits are drawn in KSP2.
Closing Thoughts When working on programming problems your first solution is rarely perfect, and it’s possible for your solution to have its own problems that you need to solve. There is far more that went into the development of this feature that I’d love to share here, from implementation details like additional heuristics, culling optimizations and choosing the right data structure for efficient point insertions, to how this can be used for more than just Keplerian orbits, but this is enough for one post. If you enjoyed this technical deep dive and want to see more stuff like it please let us know! Having the chance to share something like this with you all is very special to me. I wouldn’t be in this industry if it wasn’t for so many developers sharing their passions and inspiring me through their work online. I’ll leave you with one last debug visualization, showing the spatial partitioning used to decide when points are worth subdividing even if they’re not on screen (but one of their descendants might be):
